
Below are pictures of before and after comparisons of wave forms taken from different households. The picture below each waveform is the spectrum analysis of the harmonics present in the wave above. All of these waveforms were captured with a Fluke 190-202 Scopemeter where one input was connected to the receptacle. The other input was connected to the same receptacle except through a Graham Ubiquitous Filter (filters out the 60 Hz cycle). All of the spectrum analysis have the same scaling and the cursor (red X) is in the same place for all of them.


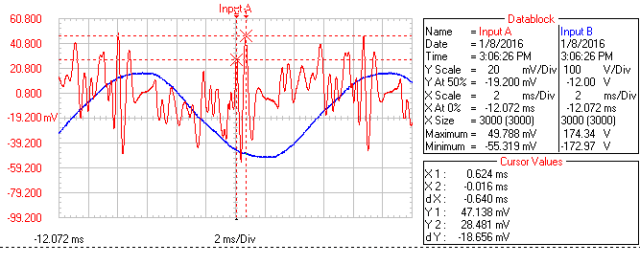

This homeowner above will only plug in a device when they plan on using them.
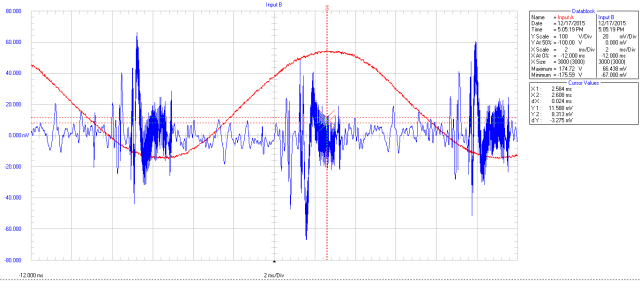


The above pictures are from my home. There are 20 Filters installed.


This home above had 16 filters installed.


This home above was large (>4000 sq.ft) with a lot of electronics and had 60 filters installed.
