
Harmonics have been around since the first AC generator was used to create electricity. They are something that anyone with an electrical background has heard of. A harmonic is an integer multiple of the fundamental frequency. Harmonics are created when the voltage and current are not used proportionately. Because of the disproportionate use, harmonics are created and added to the 60 Hz wave. Devices that do this are said to use a nonlinear load. The 60 Hz is the fundamental frequency that will be discussed today and so the harmonics created from this frequency would be as follows: the 1st harmonic is 60, the 2nd is 120, the 3rd is 180, and so on.
Most of the electronics in your home use nonlinear loads, as well as most all items marketed as energy efficient. Harmonics are a cost of having something that is energy efficient. The following is what happens when you have multiple items of these in your home. Below in Figure 1 is the waveform that is in my house when I remove all of the filters.
Figure 1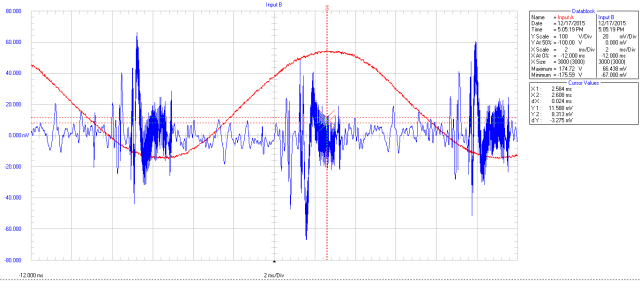
The red wave is the 60 Hz cycle. If I had no harmonics present or rather a clean 60 Hz cycle in my house the blue line would be flat. The higher density of blue represents higher frequency harmonics that are present on the wires in my house. Below in Figure 2 is a spectrum analysis of the harmonics of the blue wave in Figure 1. In short it tells you what harmonics are present and how much.
Figure 2

The red X is on the frequency of 1740 Hz for a reason. 1740 Hz is the 29th harmonic of the 60 Hz cycle. This is significant because all of the blue that you see to the right of the red X are frequencies that are going to penetrate the skin and will dissipate internally to the human body. This happens at the 1.7 KHz mark on the graph above.
After installing the 20 filters in my home, the waveform in my home is shown in Figure 3.
Figure 3

If you compare Figure 1 to Figure 3 you will see that the blue areas are much less concentrated. The Stetzerizer Filters have filtered out many of the harmonics as well as some of the voltage transients that were present on the wires in my home. In figure 4 you will see the spectrum analysis of the blue line from Figure 3.
Figure 4

In Figure 4 the red X is also placed on the 29th harmonic (1740 Hz). Everything to the right of the cursor is what is being absorbed internally. If you compare the Figure 2 and Figure 4 you will see a large number of the harmonics that have been filtered out. Stetzerizer Filters are designed to filter out the frequencies from 4 KHz to 100 KHz because these are the most biologically active frequencies. Both Figure 2 and Figure 4 are shown with the same scaling applied.
All of this information that is shown above is included in your report when you have your home tested. You will be able to see the beginning and the afterward. Every house is unique so everyone’s results will look a bit different. The only constant theme is that you will see a reduction in the harmonics in your home.
